

Dashboard and API
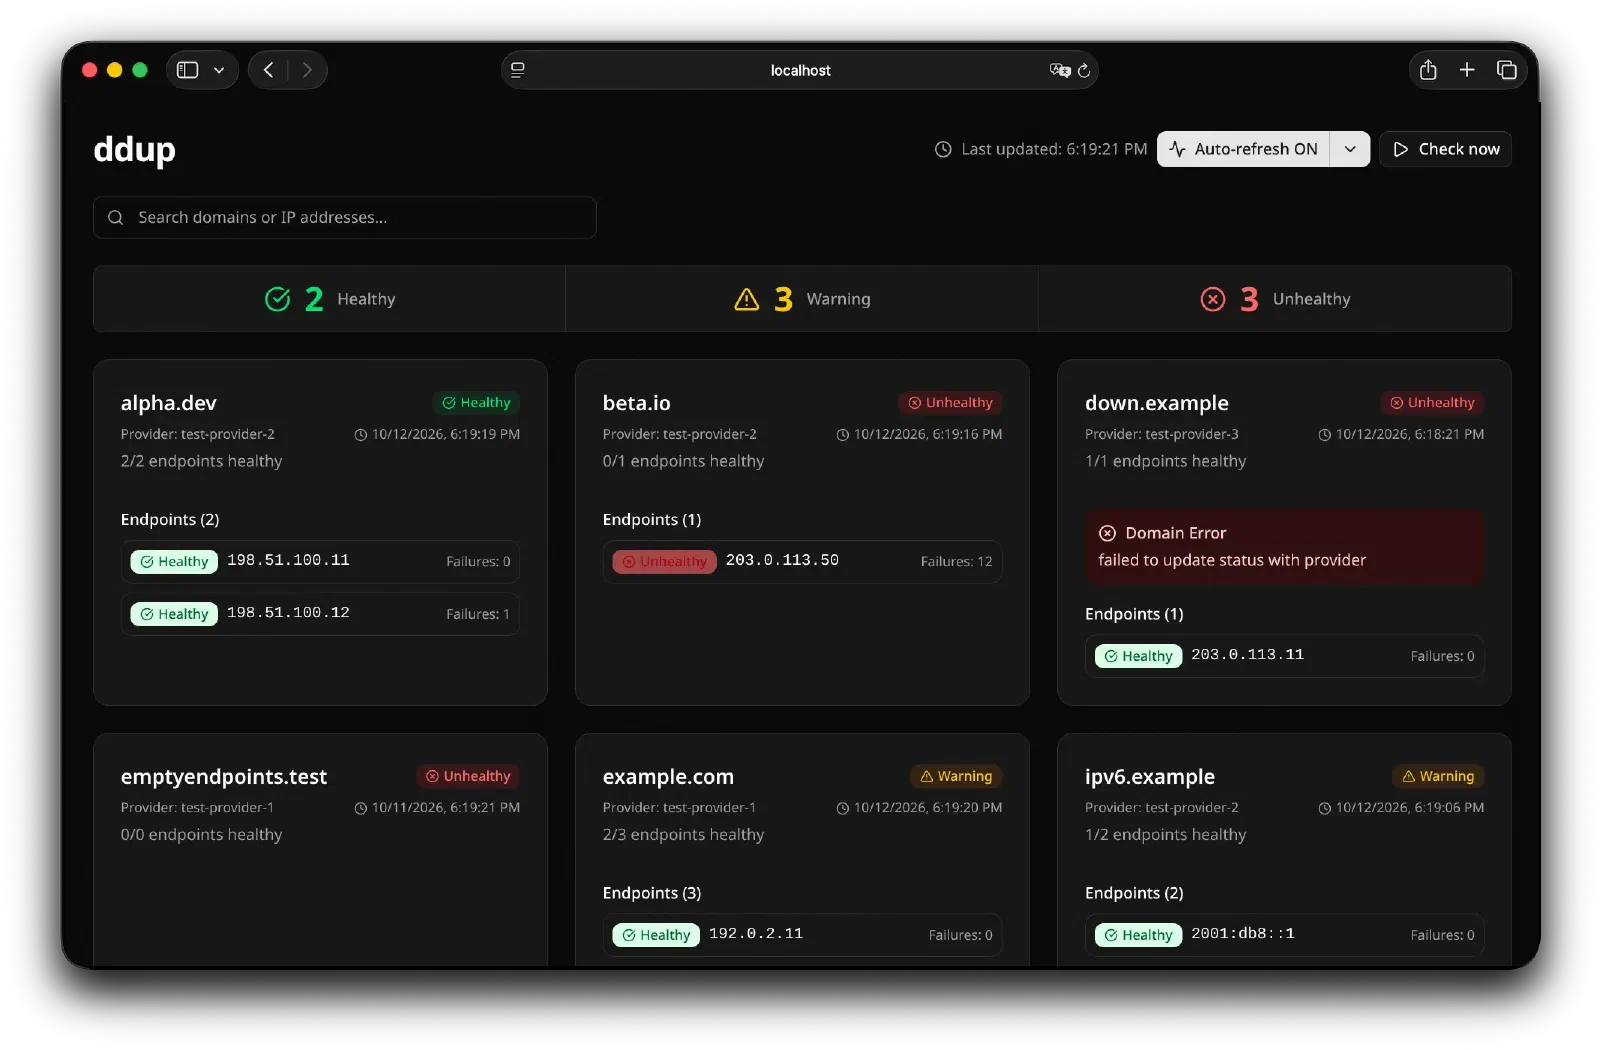
ddup includes a web dashboard that shows the health of every domain and endpoint, and an HTTP API with the same information.
Enabling the dashboard#
The dashboard is off by default. Turn it on in the configuration:
server:
  enabled: true
  # Default values
  bind: "127.0.0.1"
  port: 7401
Then open http://127.0.0.1:7401 in a browser on the same machine.
By default, ddup listens only on 127.0.0.1, so the dashboard can’t be reached from other machines. When ddup runs in a container, set bind: "0.0.0.0" and publish the port, for example with -p 127.0.0.1:7401:7401.
The dashboard and API have no authentication: anyone who can reach them can see your domains and IPs, and start health checks. To open the dashboard from other machines, put it behind a reverse proxy that requires authentication.
Using the dashboard#
The top of the page counts the domains in each state:
| State | Meaning |
|---|---|
| Healthy | All endpoints of the domain are healthy |
| Warning | Some endpoints are unhealthy |
| Unhealthy | No endpoint is healthy, or the last attempt to update DNS failed |
Each domain has a card with its provider, the time of its last check, and its endpoints. For each endpoint, the card shows its IP, whether it’s healthy, and how many checks it failed in a row. An endpoint can be healthy and have failures: it failed fewer than attempts checks, so it’s still in DNS.
API#
The API returns JSON. It’s available whenever the server is enabled.
Get the status of all domains#
GET /api/statusReturns an object with one key for each domain:
{
  "app.example.com": {
    "lastUpdated": "2026-10-13T08:15:30.123456789Z",
    "provider": "my-dns",
    "endpoints": [
      { "healthy": true, "ip": "192.0.2.10" },
      { "healthy": true, "ip": "192.0.2.11", "failureCount": 1 },
      { "healthy": false, "ip": "192.0.2.12", "failureCount": 4 }
    ]
  }
}| Field | Description |
|---|---|
lastUpdated | Time of the last check |
provider | Name of the DNS provider, from the configuration |
error | Only present when the last attempt to update DNS failed: the error message |
endpoints[].ip | IP address of the endpoint |
endpoints[].healthy | Whether the endpoint is healthy, with the same meaning as in the dashboard |
endpoints[].failureCount | Number of failed checks in a row. Omitted when it’s 0. |
For example, to list the unhealthy endpoints with jq:
curl -s http://127.0.0.1:7401/api/status \
  | jq -r 'to_entries[] | .key as $d | .value.endpoints[] | select(.healthy | not) | "\($d) \(.ip)"'
Get the status of one domain#
GET /api/status/{recordName}Returns the status of one domain, with the same fields as above. If the domain isn’t in the configuration, the response has status code 404.
curl -s http://127.0.0.1:7401/api/status/app.example.comRun the checks now#
POST /api/check
X-Requested-By: ddup-dashboard
Runs the health checks for all domains right away, updates DNS if needed, and returns the new status in the same format as GET /api/status.
curl -s -X POST -H "X-Requested-By: ddup-dashboard" http://127.0.0.1:7401/api/check- The
X-Requested-By: ddup-dashboardheader is required: requests without it fail with status code 403. It stops other websites from starting checks through the browser of someone who has the dashboard open. - If a check finished less than 5 seconds earlier, ddup doesn’t run a new one, and returns the current status.
- These checks count towards
attemptsandrecoverAfterlike scheduled ones. The next scheduled check runs oneintervallater. - If the checks take more than 60 seconds, the response has status code 504. The checks keep running in the background.
Health of ddup itself#
GET /healthzResponds with status code 204 when the server is running. Use it to monitor ddup.